Visualize JSON Data Quickly
In this article, I’ll go over extracting data from JSON files and visualizing it with bar charts, line charts, and pie charts from the Syncfusion WPF Charts control. This can be achieved with the following easy steps:
- Process JSON data.
- Deserialize the JSON data to a dynamic object.
- Convert the list of dynamic objects to a data table.
- Create beautiful charts from the data table.
We will also cover how to export the charts to popular formats like PNG and JPEG.
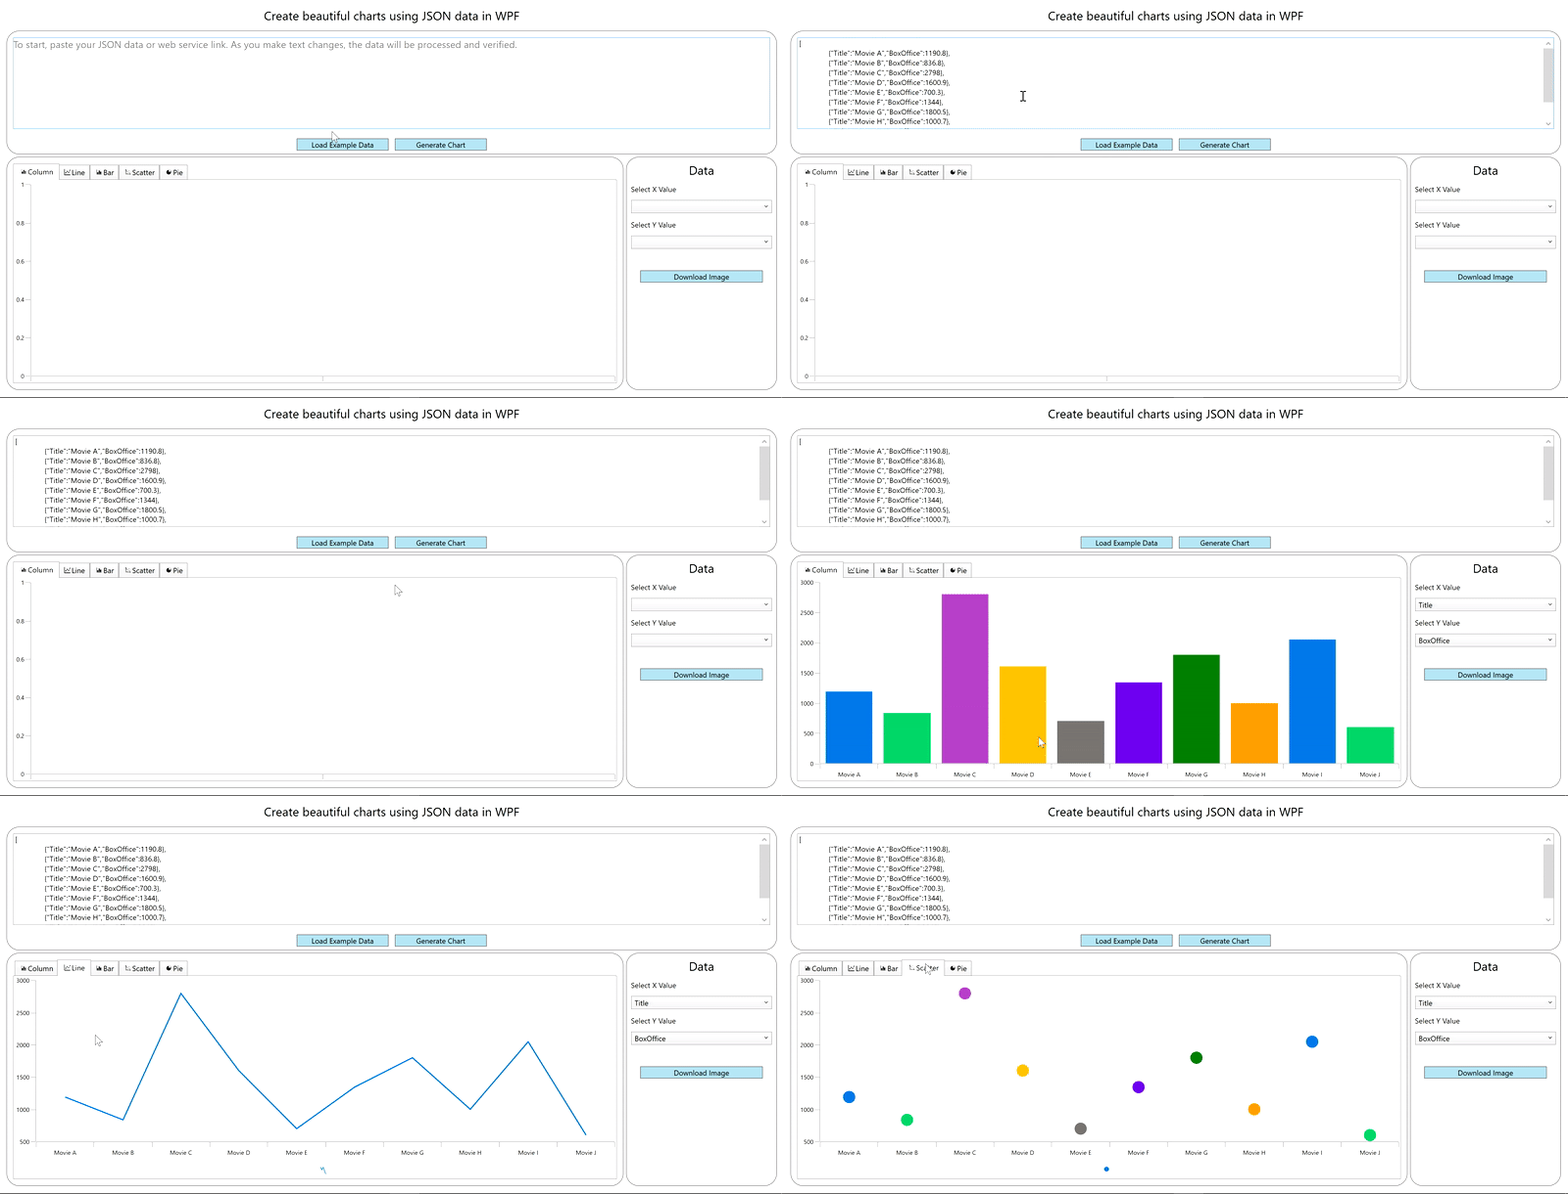
The final output of the demo app will look like the following.
 Fetch and Display Advanced JSON Data in WPF Charts
Process JSON data
JSON is one of the most widely used data formats, but working with it can be challenging. In this section, we are going to see two ways data can be retrieved from a JSON string.
Follow these steps to populate a data collection from a JSON string:
Step 1: Install the Newtonsoft.Json NuGet package in your WPF project.
Step 2: Paste your JSON string into the text box or use a web service that provides order data to obtain the data, like the following example link.
https://ej2services.syncfusion.com/production/web-services/api/Orders
Step 3: In the ViewModel class, create required properties and methods for binding the data to the chart.


